|
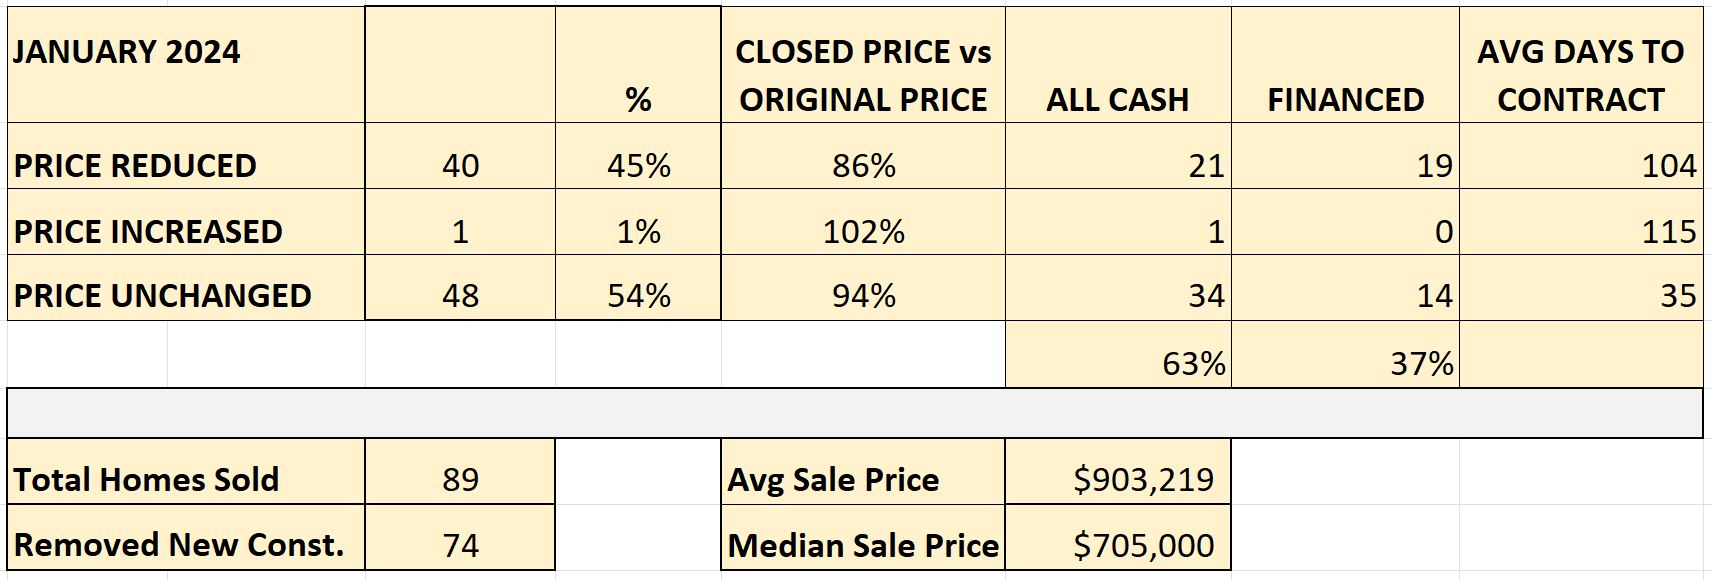
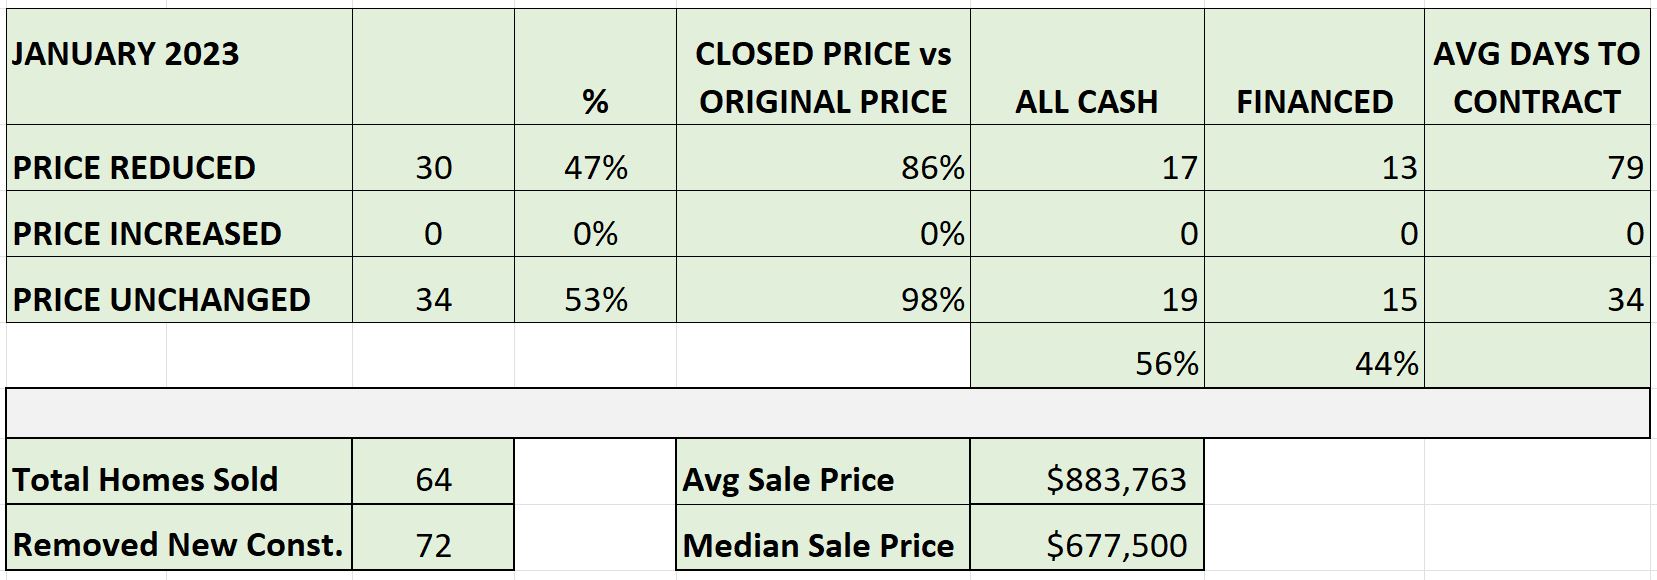
Folks… We are showing signs of a BUYERS’ MARKET here in Lakewood Ranch, Florida in 2024! Hey everyone, Michael Chenkus here. My wife Courney and I are real estate specialists in the Lakewood Ranch Florida area. Each month I review our local market data to identify trends in our real estate market. This update which covers the month of January 2024 is insanely significant to say the least. It’s the first time in a long time that we’re seeing trends pointing and leaning toward a buyers’ market. I promise… this is actually good news The market’s not tanking. So let’s look at the numbers together… We’re focused on resale homes in the three zip codes that cover Lakewood Ranch: 34202, 34211, 34240 Let’s start and look at the top-level stats… Total number of sales: up 39% The average sales price: up 2.2% The median sales price: up 4% You’re thinking… “Wait a minute you said it was a Buyer’s market. Those stats don’t really sound like a buyer’s market.” I get it. But stick with me because there are some other key data points that tell a different story. Let’s shift focus to three different metrics. -Days on Market -Sold Price vs. List Price -Absorption Rate Those three things are going to be key in this analysis. I’m seeing days on market trending upwards… This ‘Average Days to Contract’ table I put together represents all homes that sold. Anything highlighted in yellow signifies an increase in days on market… In December, the price reduced homes took 91% longer to sell. In January… homes took 32% longer to sell. The last time it wasn’t UP was October… Here’s the next stat that jumped off the page at me… The closed price vs original price. In this chart, where I want to focus the attention is January of this year. You can see that -4% which is highlighted in yellow. This year 94%.... last January was 98%. So 94% of the original list price is where these homes settled at. That’s pretty significant… Here’s a real-world example… We’ll use an $800,000 list price… 98% of $800,000 which would have been last January’s statistics means you would settle at $784,000 for that home. This year in January … you’re settling at 94%. … or $752,000. That’s a $32,000 swing. So as you can see, 4% equates to real money and real dollars in the buyers’ pocket. They’re getting better deals. So far we covered… Days on Market … UP Sales Price vs List Price… Down If we see three indicators, then I’ll be more confident saying we’re entering a Buyer’s market. A while back I did a video about Absorption Rate… a fancy way to answer … “How’s the Inventory?” “Is the housing supply meeting the demand?” Here’s how Absorption Rate works… Count up the total homes sold over a specific time period, divide by the total number of active/pending homes that are currently for sale. If the number lands between: 0-15% it’s a Buyer’s market 15-20% it’s a neutral market 20% and up is a Seller’s market. For many years now we’ve been in a strong Seller’s Market. Active listings (resale only), is right around 750 as of the middle of February 2024. Taking into account the sales pace of January (89 homes). 89/750 = 12% absorption rate That’s landing in Buyer’s Market territory. Taking into account the 4 month average.. (89+135+96+117) / 4 = 109.25) 109.25/750 = 15% absorption rate That’s landing right on the bottom side of neutral! I’ll keep tracking this statistic moving forward. Here’s the takeaway… Sales VOLUME is up 40%… Days on Market is up… Prices appear to be coming down… Curious to know how this all shakes out? So are we! For more info and tons of resources About Lakewood Ranch. -Subscribe to our YouTube channel -Visit www.SoldByChenkus.com We love helping people like you with your real estate goals. If you have any questions - Give us a call/text/email. We are Michael and Courtney Chenkus with Charles Rutenberg Realty in Lakewood Ranch Florida We truly appreciate you all…. Talk soon!
0 Comments
|
|
Charles Rutenberg Realty
8130 Lakewood Main Street | Suite 103 | #404
Lakewood Ranch, FL 34202
941-348-2653 | Sitemap | Accessibility


 RSS Feed
